We are entering the fourth quarter of 2022. The bear market is in full force now, down over 25% by most market indices, and the questions are swirling. News media pundits are speculating on what is happening, why, and how long it will last.

Many of us are wondering what we should do. What's going to happen next? And how will things impact our long-term goals? There is no shortage of speculation.
And as you can imagine, in a practice like ours, we have access to many data points, opinions, and historical information. And that's why we continually try to focus on the historical evidence for history like we're experiencing now versus sensational headlines.
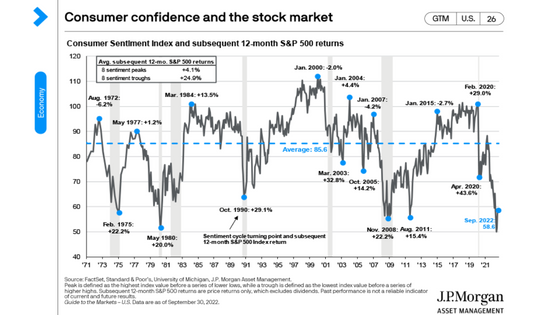
I've recently seen an interesting chart courtesy of our friends at J.P. Morgan. I think you'll find it thought-provoking because it helps to compare how we feel about things versus what has historically happened afterward in one visual diagram. 
You may even look at the main line as it travels up and down and think this is how I've been feeling. Please remember it is not the stock market. In fact, this chart is actually a depiction of the last 50 years of Consumer Sentiment Index ratings.
Every month for more than 50 years, the University of Michigan has executed telephone surveys of more than 500 people. They ask the respondents questions about their finances, spending, outlook, and business transactions. And based on the responses, they assign a Consumer Sentiment rating.
Sometimes people are feeling great, and the Consumer Sentiment Index is high. Other times people feel concerned, scared, bearish, and the consumer sentiment is low. You can see the blue dashed line across the center of this shows that the average Consumer Sentiment Index rating is about 85. There are some periods where people are more optimistic than average and others where people feel more pessimistic than average, but on average, it's around 85.
Now, the interesting question that this chart helps to answer is - when we're feeling optimistic and good, is that because things have been going well? Or is that a leading indicator that things will go well? And conversely, when we're feeling scared, confused, nervous, a lower Consumer Sentiment Index, is that because things have been going poorly? Or is it because things will go poorly?
The economic approach to this is whether our feelings are a lagging indicator, lagging what has occurred or is the Consumer Sentiment Index a leading indicator of what will happen.
The chart has overlaid the S&P 500's performance for the twelve months following the consumer sentiment readings. And this is where it gets fascinating. You can see that when we look at this particular diagram. There are eight places where consumer sentiment has peaked on this chart and eight places where it has bottomed out. Eight peaks and eight valleys. And then, we can review what the S&P 500 has done in the following twelve months. For example, after the peak reading in August of 1972, the S&P 500 proceeded to drop 6%, not counting dividends over the next twelve months.
The reading in May of 1977 showed that the market was basically flat, about 1%. However, when we look at the troughs, the valleys, and the lowest points of consumer sentiment readings, we can then compare what the market has done. For example, at the end of June 2022, the Consumer Sentiment Index was at its lowest point in the last 50 years, only rebounding slightly by the end of the third quarter. But after May of 1975, the S&P 500 proceeded to go up 22%. And in each of these low points, the market twelve months later was up at double digits.
And it begins to show that historically the Consumer Sentiment Index has been inversely tied to the market's performance over the next twelve months, at least when we're in a bottom or a trough scenario. In fact, we can see that after the eight lowest points of consumer sentiment in the last 50 years, the market has returned nearly 25% over the following twelve months, not counting dividends, compared to a return of only about 4% following the peaks.
Now, I'll be the first to tell you that I have no idea what the market will do over the next twelve months this time. But as I said before, with our commitment to focus on historical evidence and not sensational headlines, it's evident that looking backward, the market has always performed far better than people are feeling when we are feeling our worst.
If you have any questions about consumer confidence or financial planning, don't hesitate to contact one of our financial professionals. We're here to help.
CRN202510-3252138

Shane Tenny, CFP®, is the Managing Partner of Spaugh Dameron Tenny and a nationally recognized financial advisor. Since 2000, he has combined extensive financial knowledge with a passion for behavioral finance—helping clients make informed decisions based on both data and mindset. Shane often contributes to industry publications, appears as a guest on podcasts, and has been a leader in the financial planning field for years. He is known for making complex topics clear and practical for busy, high-income professionals seeking personalized advice they can trust.
At Spaugh Dameron Tenny, part of our role is helping clients start each year grounded in facts, not headlines, assumptions, or half-answers. When ...
Read More →Many investors consider rental real estate and diversified portfolios as potential sources of passive income, but each comes with its own ...
Read More →After more than two decades helping families across the country, I’ve learned something surprising: Even highly successful people don’t always know ...
Read More →