As we are counting down the days until the presidential election, when we will discover the fate of the United States for the next few years, we wanted to share some insights about this current election cycle.
Whether you get excited about election years or you can’t wait until the political ads stop flooding your news feed, a presidential election always brings uncertainty.
After the first presidential debate, you may feel a little anxious. In the current economic and political climate there is a lot of turmoil. Between continued COVID-19 relief negotiation and the Senate hearings about the Supreme Court Justice nominee to replace Ruth Bader Ginsburg, you may have started to wonder how your investments may be impacted.
What do these events mean for the markets?
What does this mean for your financial goals and investment portfolios?
As always, at Spaugh Dameron Tenny, we want to emphasize to not just focus on the headlines that are brushing us daily. Instead, look at the vital historical data and context that affects your investments and financial future.
Watch this video to hear my take on the impacts of the election on the market or read on:
Let's set the stage by sharing a diagram with you below, from Capital Group, that outlines what are the most likely outcomes of the election. On the horizontal axis, you see the presidential election outcome. The blue being a win by Joe Biden and the red on the right side being a win by Donald Trump.
.jpg?width=1920&name=Pages%20from%20Webinar_Election%20watch%20and%20Washington%20update%20(Brochure).jpg)
One of them is likely going to win. While it's beyond the scope of our discussion here to talk about the constitutional implications of a contested election, we'll end up with either a democratic or republican president in the near future.
Currently, there's some uncertainty in the Senate because the Senate is controlled by the Republican Party. With just a little bit of swing, there could be a flip in control to Democrats.
You notice on our chart here the House of Representatives is not a big factor. Of all of the 435 congressional representatives up for re-election, there's only a portion considered to be in battleground positions. For the Republicans to win control of the House, they would need to gain a net 20 seats, which seems like a pretty unlikely scenario. According to Business Insider, there are currently 234 Democrats, 198 Republicans, one Libertarian, and two vacancies. Due to the low probability of the Republican party winning control of the house in this election, it is not factored into the analysis of the data shared today.
Based on the outcome of the Senate and the White House, we certainly have different policy priorities between Donald Trump and Joe Biden. You couldn't get a more stark difference on topics like taxes, spending, or corporate regulation.
President Trump has talked a lot about his desire to continue tax cuts and reducing regulation. On the other hand, Joe Biden has made it very clear that he would anticipate an increase in certain tax rates for Americans at the top marginal tax bracket. Biden has also hinted at increasing capital gains taxes on households with over a million dollars of income, as well as, increasing the corporate income tax rate from the current level to about 28%.
With that said, it's important to address the elephant in the room. Should you begin making investment portfolio changes based on potential tax changes? After all, Vice President Biden has made it very clear that he sees the need and would take action to support increasing tax rates in certain segments of the economy if he were to take office.
Biden has also said he would not take on a tax overhaul during the continued global pandemic, economic uncertainty, and threat of recession that continues to persist. Moreover, it seems like even if Vice President Biden wins the White House, the tax policy elements wouldn't really be advanced until perhaps 2022 at the earliest. This would also be dependent on who has the majority in the Senate: the Democratic Party or the Republican party.
With so much uncertainty and possible outcomes depending on which presidential candidate wins, you might be wondering: is Joe Biden or Donald Trump better for my investment portfolio?
The graph below should help you find the answer of which party is better for you. It draws data from 88 years of election cycles. You can see there have been cycles, where the Democratic Party has controlled the White House and periods when the Republican Party has controlled the White House.
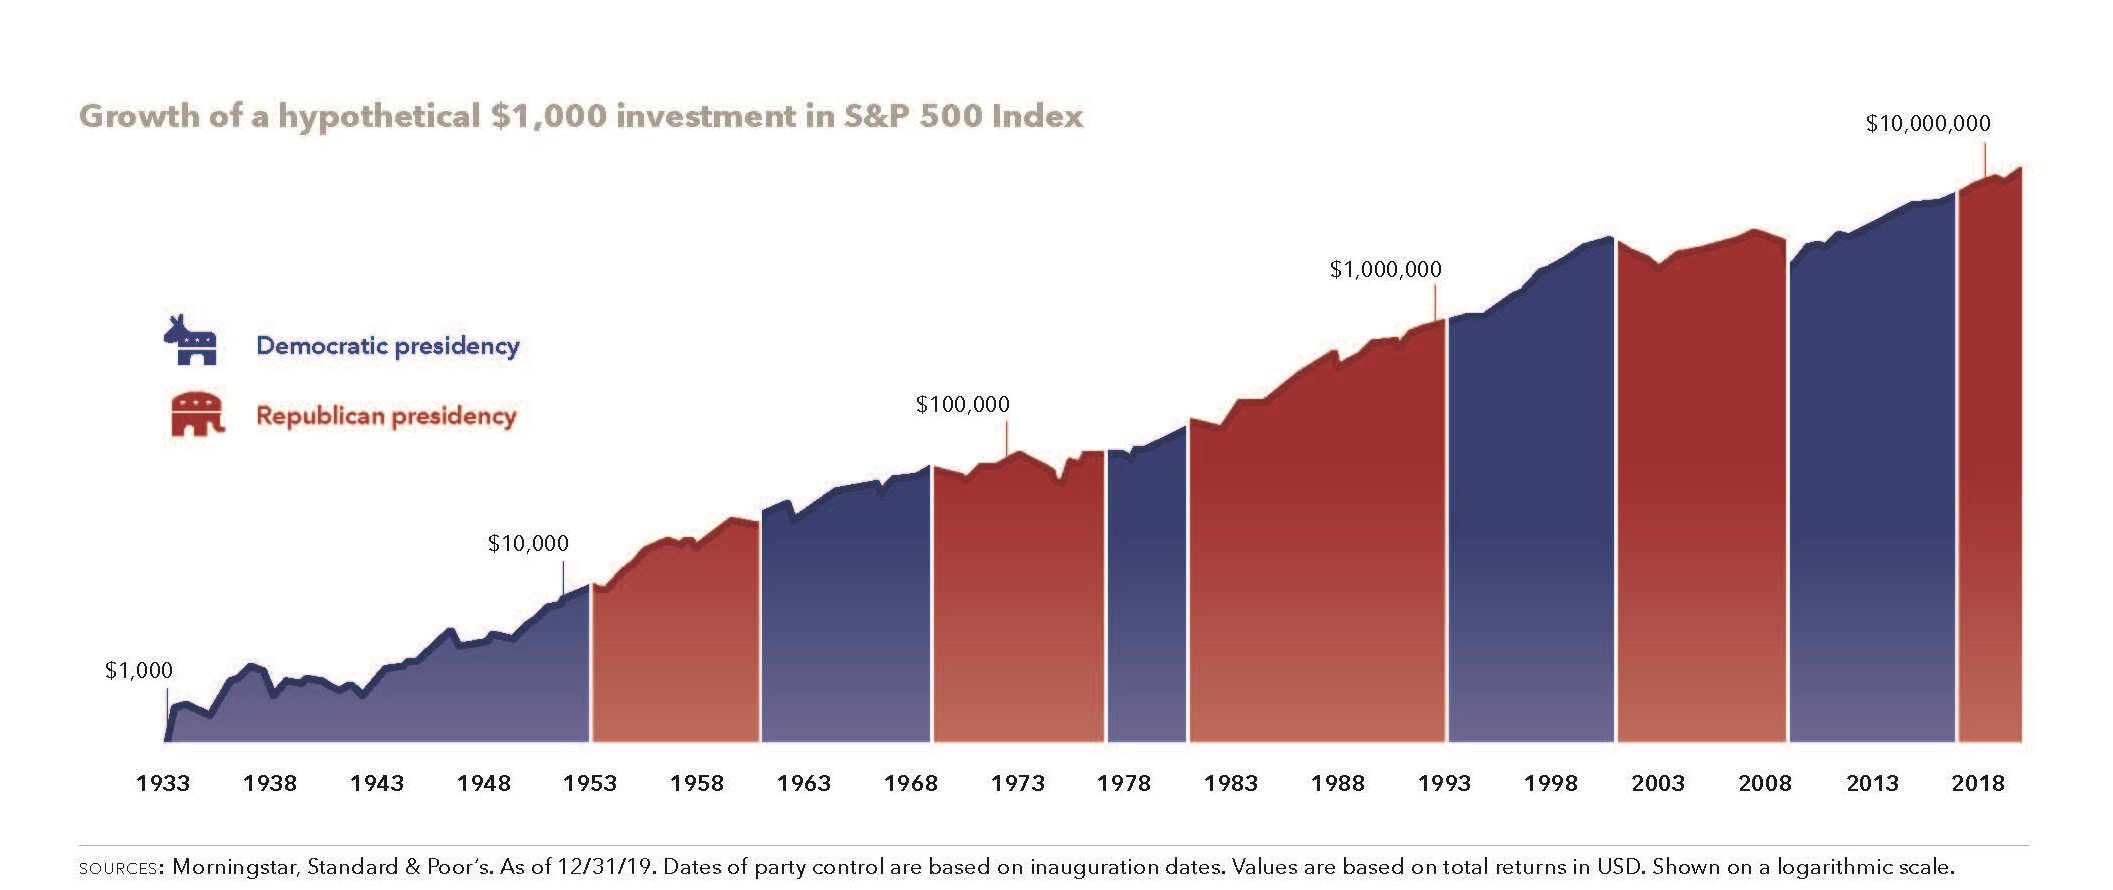
Interestingly, there have been seven Democratic presidents and seven Republican presidents represented on this chart. The key takeaway is:
The stock market has trended up regardless of whether a democrat or republican is in the White House.
Amid political unrest and turbulence, it may be hard to believe this is true. There are certainly economic and political challenges the White House and our country have faced, but another important takeaway is that corporations and the CEOs and board of directors that control those publicly traded corporations find ways to grow their value, in turn growing the wealth of their shareholders in the midst of those storms.
The strength of these companies and their ability to survive and even thrive explain the perpetual upward trend of market valuations, regardless of which party is in control.
Though the stock market seems to consistently trend up no matter who is President, the stock market does tend to behave differently in an election year than in a non-election year.
That doesn't mean the returns are significantly less, but election years often cause more volatility in the market, as you can see on the diagram below. 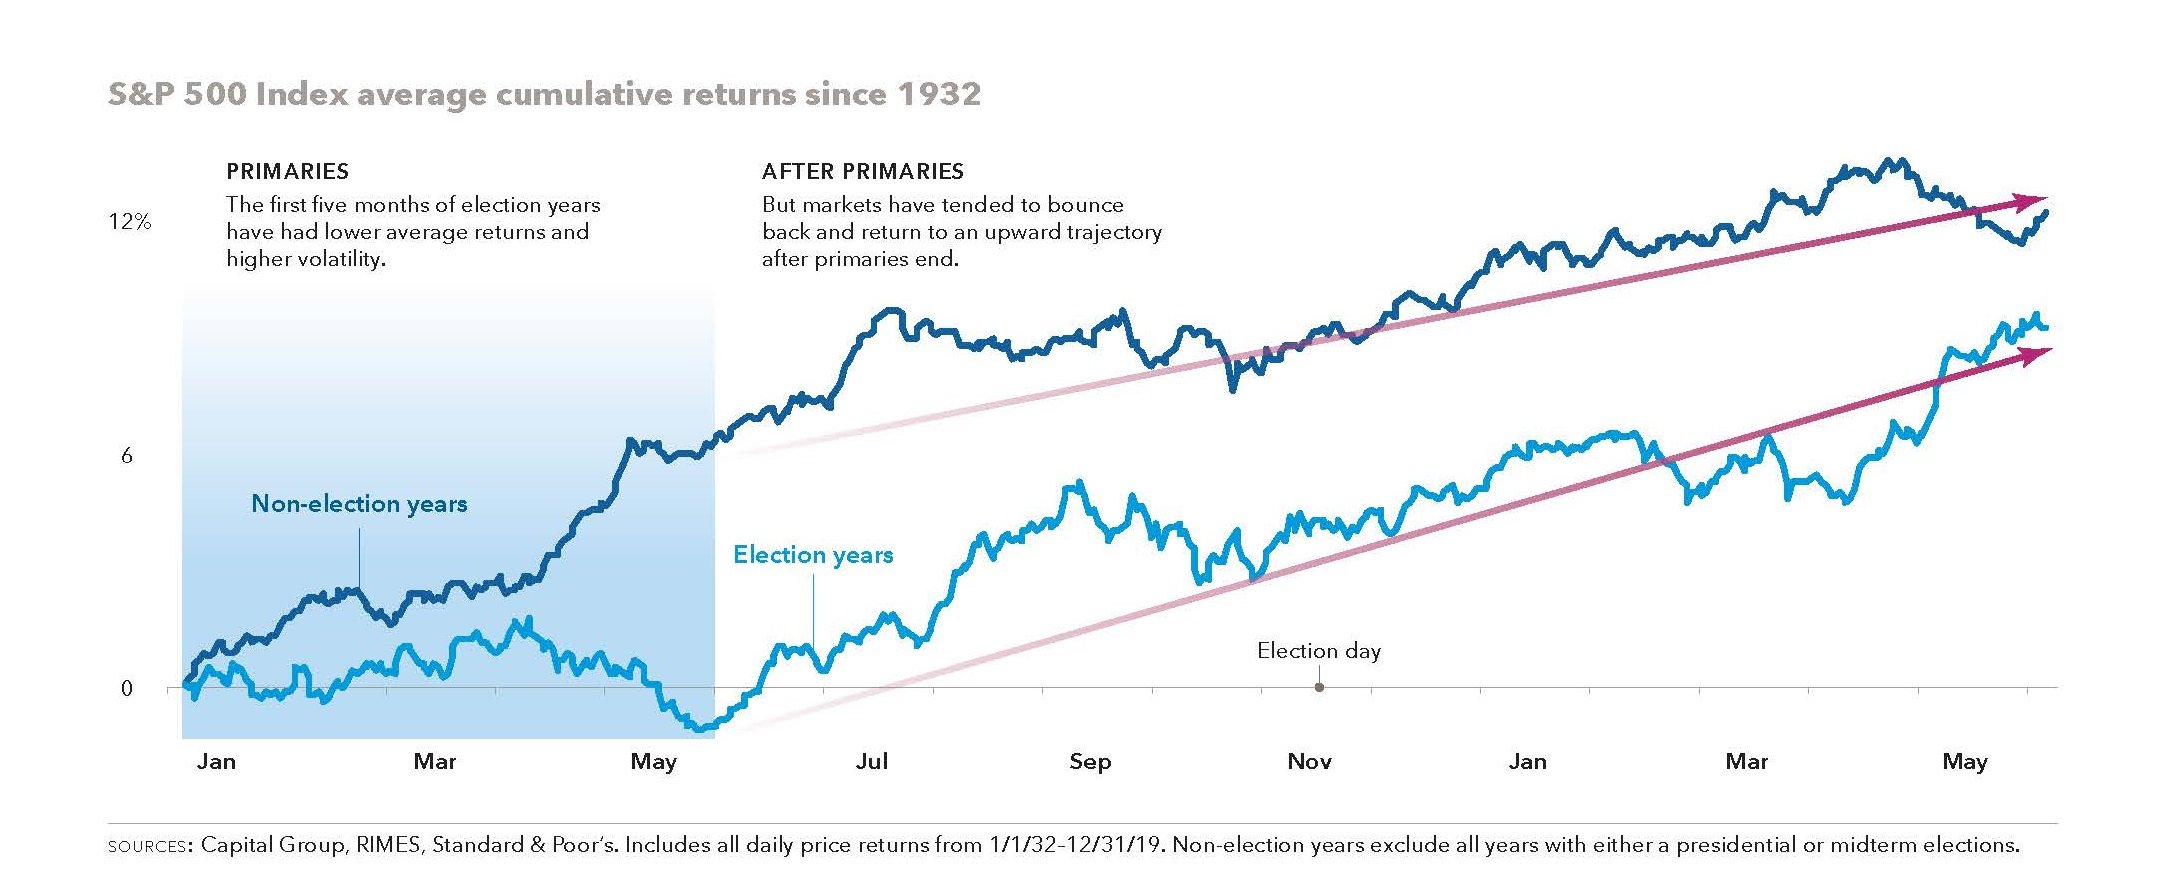 Often leading up to the primary elections, there is more uncertainty as several candidates hit the campaign trail to compete for the party's chosen candidate. In addition to the competition among parties, the 2020 primaries have been dominated by the coronavirus pandemic. As the landscape begins to narrow and each party selects their candidate, we gain more clarity in what is going to happen. Then corporations can begin to anticipate policy that's going to help advance their shareholder value and we see things begin to trend upward.
Therefore, in a non-election year. The returns between June and the end of the year, (end of the cycle) are about 6% and in an election year, like this one, we see such flat market returns and volatility early in the year, then the returns have increased to north of 10%.
If you look carefully at the light blue line or the line reflecting kind of election, it’s interesting to note the presidential election cycle between September and November. During these months where there is often a little uptick in volatility, accompanying tighter polling and greater uncertainty of who's going to win.
As we get closer to election day, we see greater animosity and frustration between political parties, resulting in the market pulling back pretty notably through September. Again, the overall average return has shown gains, even during election cycles.
When investors expect volatility from the unknown, they often respond with risk minimizing actions. The chart below illustrates the average net fund flows by year of presidential term since 1992. An interesting thing about this chart is it highlights one of the mistakes that often manifests, and that is investors often sit in cash or move to cash leading up to the election, which is a timing strategy that often is not the most profitable.
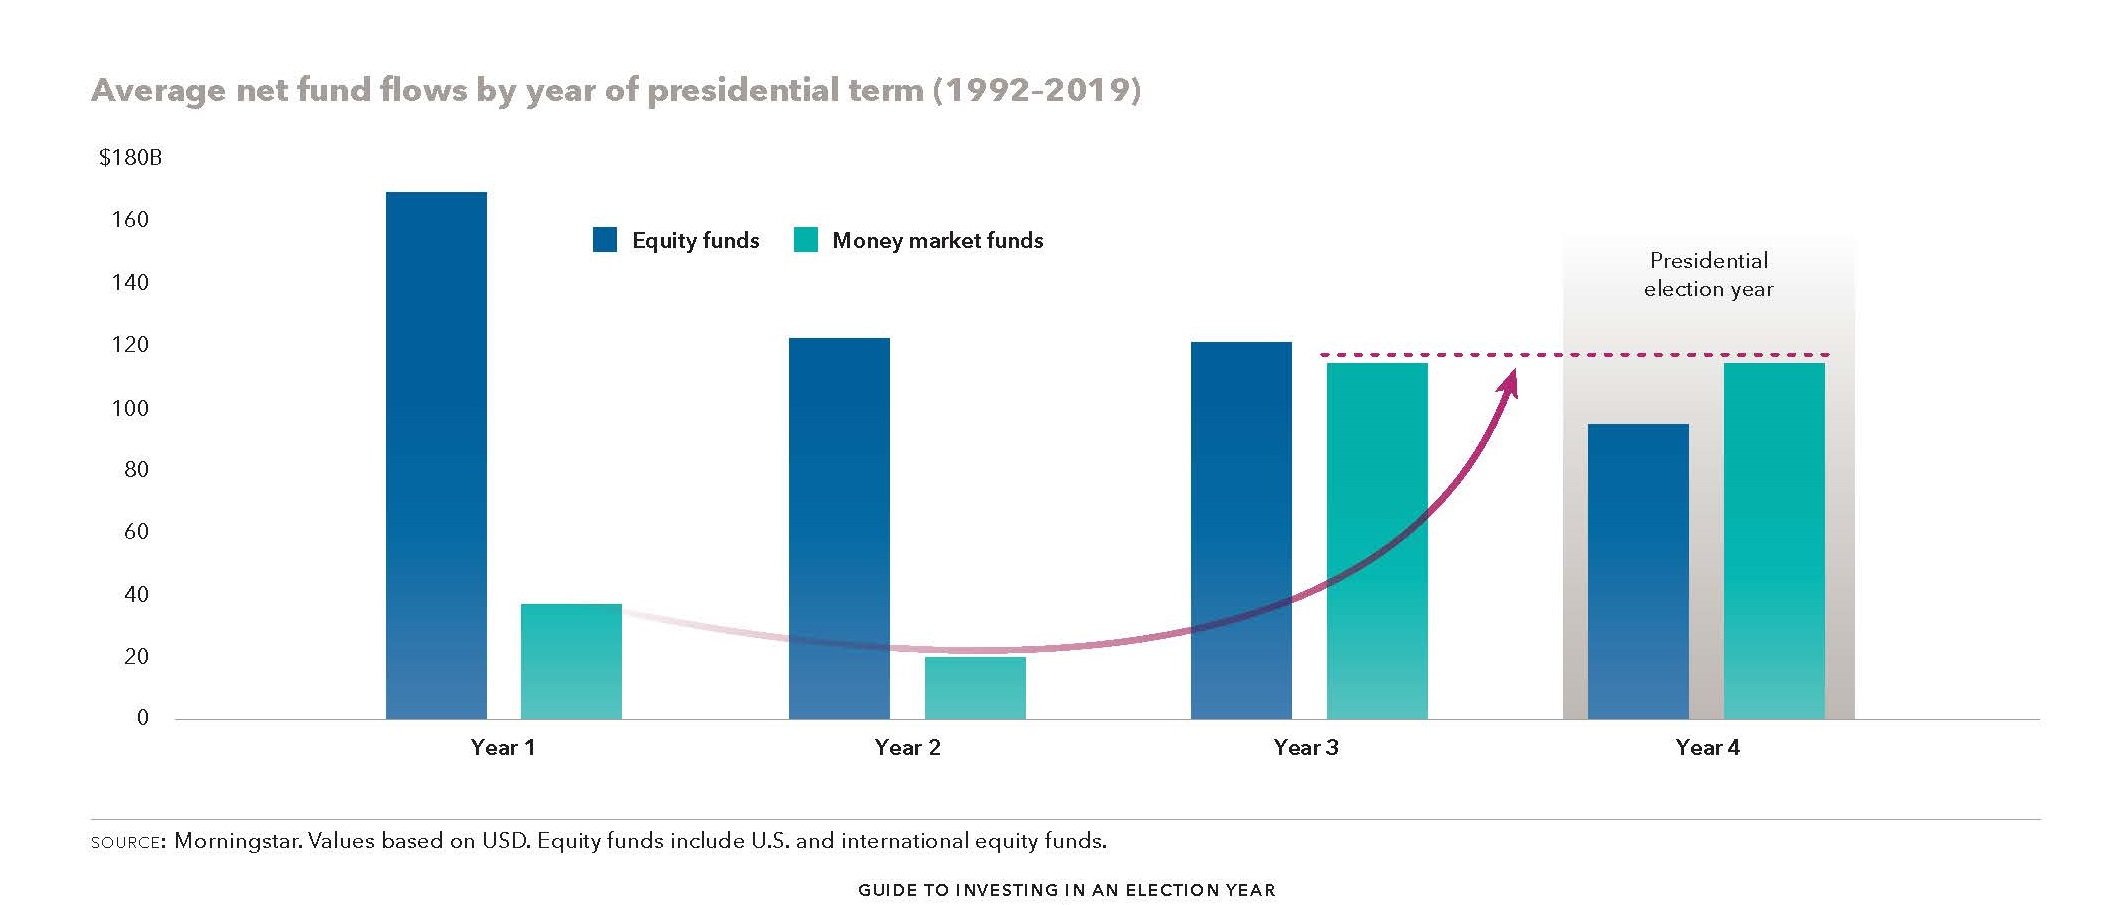
Let's dive deeper into what this chart is telling us. Year one is the first year of a president's cycle, so in this case would be 2021. Year four is the election year (the one we're in now) and what you see if you look at the green/turquoise bar is the deposits going into money market funds or savings accounts, which tends to increase significantly leading up to the uncertainty of the election and then immediately following the election, the money swings and begins to flow into equity funds or stock funds.
It’s natural to be nervous, but it's important to stay disciplined. By moving to cash while funds are flowing into equities means the prices are rising before you own those particular securities.
The bottom line is in the shaded box, you can see investors often get nervous and move to cash during an election year, which has shown to rarely be a winning strategy.
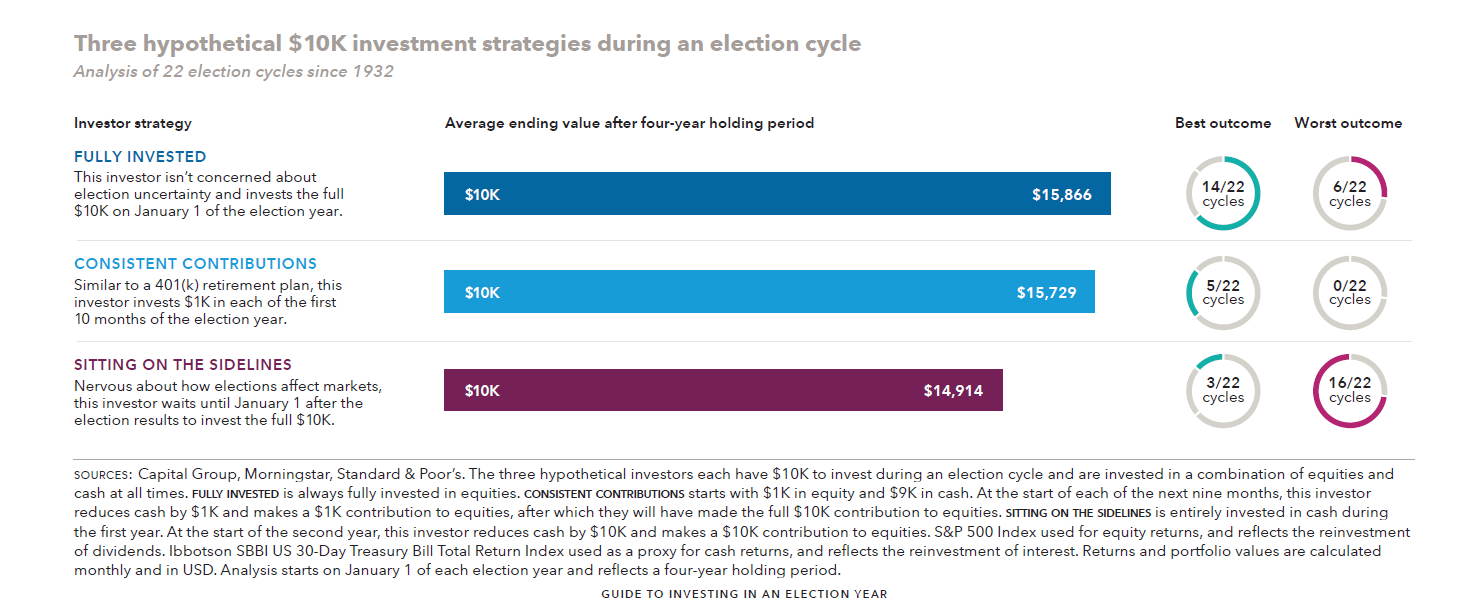
Now that you see the typical way investors respond to election years has not proven to be the most profitable, what is the best way to invest your money during election years? As you can see in the detail graphic below, we've got three scenarios compared for investors who invest $10,000.
Now, here's a spoiler alert:
The best way to invest in election year has almost never been sitting on the sidelines.
First, let's discuss the 3rd investor strategy (burgundy bar) at the bottom, which is an investor that decides to sit on the sidelines. This investor has $10,000 in cash in January of the election year and essentially says, “I want to wait and see what's going to happen before I invest the money.” When the election comes and goes, their money is safe in cash and they invest in the January following the election.
Now, the average value of that account over the last 22 election cycles at eight years at the end of the four-year presidential cycle is just under $15,000. In fact, as you see in the little circles on the right, they're in 16 out of the 22 for your presidential election cycles, this has resulted in the smallest account balance or the worst outcome.
In contrast, the top bar shows an investor who's not concerned about the election and invest as $10,000 at the beginning of the election year stays invested for four years and the average ending value after the four-year holding period is nearly $16,000. This scenario provides the best financial outcome in 14 out of 22 cycles.
Interestingly, the middle chart is also worth noting, and that is consistent contributions. This is good illustration of what happens in a 401(k) account where an investor invests $1,000 a month every month for 10 months, starting in the election year and then stops. The average value of the fully invested “consistent contributions” investor scenario is not the best outcome in very many of these cycles, but you see it has also never been the worst outcome in any cycle.
So perhaps this commentary can offer guidance on the strategy that's most appropriate for you and your goals. The bottom line here is that staying on the sidelines has rarely paid off. As we often say: it is time in, not timing the market that matters most.
With the election quickly approaching, these tips can help you now or in future election cycles. The key take-aways for you to remember:
Does thinking about retirement and wondering if you'll have enough money make you anxious? Make sure you're on track for a stress-free retirement with the SDT Retirement Checklist.
CRN202210-272696

Shane Tenny is the managing partner of Spaugh Dameron Tenny. Along with hosting the Prosperous Doc® podcast, Shane has a true passion for behavioral finance, helping clients and audiences understand how to develop successful strategies based on their unique temperaments. An accomplished and highly engaging speaker, Shane is regularly interviewed for television and podcasts, is actively involved in the Financial Planning Association®, and contributes to industry advisory boards.
An exchange fund allows investors to contribute concentrated stock positions into a pooled fund with others. In return, participants receive a ...
Read More →Retiring before age 60 is a dream for many, but accessing retirement funds early without triggering penalties can be a challenge. Traditional ...
Read More →It’s not uncommon for executives to build wealth through a concentrated position in one or a few stocks. This most commonly happens through equity ...
Read More →